
County Tax Re-Assessment Impact Visualized

There are a few key points to understand about the data maps. They are derived from a combination of reappraisal data and information obtained from the county’s GIS Parcel Viewer website.

(An interesting side note: Since we published our article on February 6th, “County Tax Burden by School District”, in which we mentioned extracting data from the county maps, the GIS Parcel Viewer website has been taken down. We’ll leave it at that—though we hope we don’t sound like conspiracy theorists.)

One major issue with the data is inaccuracies regarding the physical location of parcels. Many large farms, mineral exploration companies, and private camps have mailing addresses that differ from the actual parcel location. This location is commonly referred to as the Situs Address. However, neither the data obtained through our right-to-know request nor the data extracted from the Parcel Viewer website contain the correct situs addresses. As a result, some anomalies appear in the maps, where parcels seem to be located outside county lines. This occurs because, in the absence of a situs address, the plots are mapped to their mailing addresses instead. That said, the tab 1 labeled “Based on $ Change by District” accurately reflects the school district in which each property is physically located.

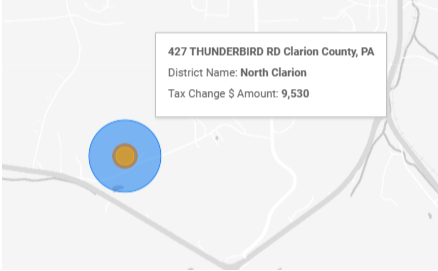
Both maps visualize data based on the actual dollar amount increase in parcel taxes rather than percentage increases. This approach better highlights the significance of the changes. In some cases, the bubbles or heat signatures represent multiple parcels owned by a single entity.

For example, one bubble represents a combination of parcels owned by the same entity, which experienced the following increases in county tax burden:

  • $9,530 in North Clarion SD
  • $930 in Clarion-Limestone SD
  • $1,950 in Clarion Area SD

These figures exclude school taxes. Their current county tax burden stands at $3,970 and will increase by $14,020, bringing the total county tax burden to $17,900. Keep in mind that this amount does not include additional tax burdens from school districts and other municipalities.

mapSample2


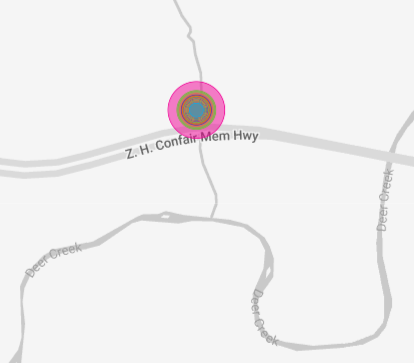
Another noteworthy anomaly is the large parcel situated between Williamsburg and Wentlings Corners near I-80 on Boyd Run. Several parcels appear at this location due to inaccuracies in the databases regarding parcel addresses. It is likely that these addresses fall outside the county lines and are based on mailing addresses rather than actual situs addresses.

mapSample1

 Alas, the maps. Please reach out and let us know if you would like any additional views of this data. Contact Us Here 

If the box below is not loading, or you want to see a full screen view of the map click the following URL: https://lookerstudio.google.com/reporting/3ea3317a-7174-4757-923d-00c8e264ac2d

County Tax Burden by School District

While we are awaiting the outcome of our appeal to the Office of Open Records regarding our latest RTK request for commercial data, we've been reviewing the residential data in the meantime.

It's important to clarify that this data does not pertain to school taxes. Instead, it reflects county tax revenue distributed by each school district. The dataset is a combination of information obtained through RTK requests and data extracted from the County Parcel Viewer (which you can explore to view property lines, similar to OnX Maps  {Mysteriously, as of 7:40am 2/8/25, the county hosted map is offline. Thank goodness we already have the data}). We utilized this data to identify which school district each property belongs to.

The two main areas of interest are:

  1. The percentage of residential properties versus the tax burden they experience.
  2. The percentage change in tax burden for each district.


See the data attached below:

Attachments:
Download this file (TaxbySD.pdf)County Tax Burden by School District.pdf61 kB133 Downloads2025-02-06 20:37

Summary Outcome of our Findings

While it is generally agreed that basing assessments on current market values is beneficial, our research has uncovered several multifaceted issues. According to the county:

"Based on a typical countywide reassessment, about one-third of the tax base will see a decrease in their tax bills, one-third will stay the same, and one-third will pay more. A change to an individual’s property taxes depends on whether the increase in the 1975 value to a January 1, 2025 market value is more or less than the average increase experienced in the taxing district."
(Source: Clarion County Reassessment 2026)

Our calculations, excluding Clean & Green discounts, indicate that:

  • 19% of taxpayers would see a decrease in taxes totaling $459,330.
  • 3% would experience no change.
  • 78% would see an increase in taxes totaling $4,019,090.

If all eligible taxpayers take advantage of the Clean & Green program:

  • 30% would see a decrease in taxes totaling $668,830.
  • 4% would remain unchanged.
  • 66% would see an increase in taxes totaling $2,379,710.

UPDATE: AFTER FURTHER INVESTIGATION IT APPEARS THE TAX BURDEN FOR C&G WILL SHIFT TO OTHER PROPERTY OWNERS. READ MORE HERE.


The county also states:
"Pennsylvania state law requires that after the tax base has been equalized and brought to current market value, the millage must be reduced to collect the same revenue as in the previous year. After the equalized millage is set, if the taxing body needs additional revenue, they may collect it, but they are limited by law on how much additional revenue can be collected in the year following the countywide reassessment."
(Source: Clarion County Reassessment 2026)

Our findings, excluding Clean & Green discounts, show that property reassessments will increase county tax revenue by 44% higher, from $8,050,810 to $11,610,570, resulting in an additional $3,559,760 in revenue.

If all eligible taxpayers utilize the Clean & Green program, the county's revenue increase would be 21% higher, from $8,050,810 to $9,761,690, adding $1,710,880 in revenue.

Despite these projections, the assessments don’t always align with expected property values. Discrepancies exist on both ends, raising questions about the accuracy of the reassessment process.

For instance, we’ve identified cases where newer homes (built within the past eight years) face higher tax burdens despite no improvements or changes to the properties during that time. While assessed values should reflect market changes, millage rates should decrease proportionally, keeping tax burdens relatively consistent. These inconsistencies suggest a need for closer scrutiny of the reassessment process.

See the data by clicking here! This contains the assessment information for every residential property in the county. Names have been removed to respect the privacy of others. 

The Data

Attached below you will find both the excel spreadsheet version of the data and a PDF of the data. Both documents can be searched by clicking crtl+f at the same time they type what you're looking for.

The purpose of us sharing this data is not to enable individuals to scrutinize their neighbors but to provide information and comparisons to ensure Clarion County acts in the best interests of its taxpayers. To focus on property values rather than individuals, we have removed names from the data obtained through the Right-to-Know process. Our goal is to highlight apparent issues with Clarion County's approach to tax appraisals.

With the exception of columns I - "Difference with C&G" , J - "Difference w/o C&G", and N - "Tax", the data on the second sheet of this workbook, titled "County Data," was provided by Clarion County through a Right-To-Know request. Columns I, J, and N were created to perform additional calculations.

The first sheet, titled "TaxClarion.com’s Calculations," contains the results of our computations.

We encourage you to review our formulas and notify us of any errors you may find by emailing us at This email address is being protected from spambots. You need JavaScript enabled to view it..

 UPDATED Info:

We have had quite a few folks reach out to help and share information. We had a member of our facebook group take the data and make it even easier to navigate! This is EXACTLY what we had hoped would happen. Here is a link to their website with and easier way to view the data. Just type in the address or the parcel ID: https://clariontax.info/ 

*It appears the percentage value is incorrect on their website but the rest of the information is correct. We have reached out to try to have them correct the percentage.

Attachments:
Download this file (TaxClarionData.pdf)TaxClarionData.pdf2582 kB763 Downloads2025-01-18 11:28
Download this file (TaxClarionData.xlsx)TaxClarionData.xlsx4170 kB466 Downloads2025-01-18 11:31